In my role as a Talent Intelligence Analyst, I undertook a compelling project focused on analyzing and understanding self-employed trends in the Netherlands. The project spanned multiple years, encompassing detailed quarterly data from 2016 to the third quarter of 2023.
Data Processing and Preparation: I began by loading and preparing the dataset, emphasizing the importance of clean, structured, and reliable data. The dataset was meticulously processed to extract meaningful insights.
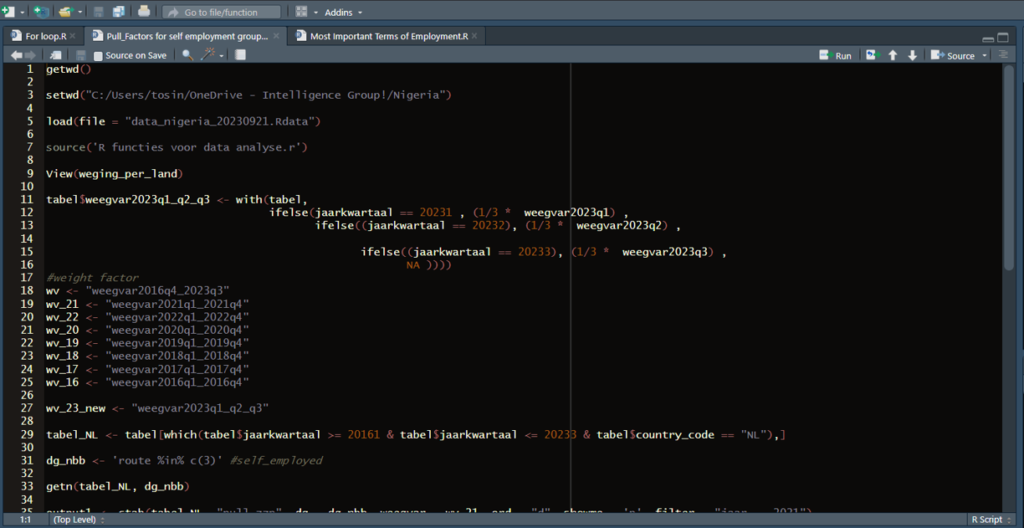
getwd()
setwd(“C:/Users/tosin/OneDrive – Intelligence Group!/Nigeria”)
load(file = “data_nigeria_20230921.Rdata”)
source(‘R functies voor data analyse.r’)
Temporal Weighting for Enhanced Analysis: To enhance the temporal granularity of the data, I introduced a sophisticated temporal weighting mechanism. This involved creating a new variable ‘weegvar2023q1_q2_q3’ that dynamically adjusted the weight based on the quarterly distribution.
tabel$weegvar2023q1_q2_q3 <- with(tabel,
ifelse(jaarkwartaal == 20231 , (1/3 * weegvar2023q1) ,
ifelse((jaarkwartaal == 20232), (1/3 * weegvar2023q2) ,
ifelse((jaarkwartaal == 20233), (1/3 * weegvar2023q3) ,
NA ))))
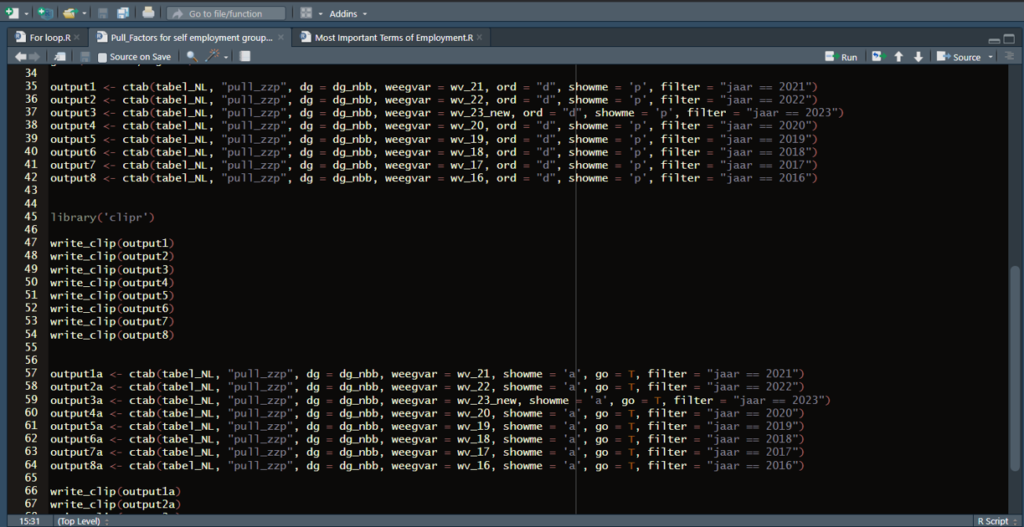
In-Depth Analysis with Comparative Metrics: The core of the analysis involved deep-diving into self-employed data, segmented by years. Utilizing the powerful ‘ctab’ function, I compared and contrasted key metrics across pivotal years – 2021, 2022, and 2023 Q1-Q3.
output1 <- ctab(tabel_NL, “pull_zzp”, dg = dg_nbb, weegvar = wv_21, ord = “d”, showme = ‘p’, filter = “jaar == 2021”)
output2 <- ctab(tabel_NL, “pull_zzp”, dg = dg_nbb, weegvar = wv_22, ord = “d”, showme = ‘p’, filter = “jaar == 2022”)
output3 <- ctab(tabel_NL, “pull_zzp”, dg = dg_nbb, weegvar = wv_23_new, ord = “d”, showme = ‘p’, filter = “jaar == 2023”)
Visual Representation for Enhanced Interpretation: To make the findings accessible and visually compelling, I utilized the ‘clipr’ library to store and share the results conveniently.
library(‘clipr’)
write_clip(output1)
write_clip(output2)
write_clip(output3)
Strategic Insights and Future Perspectives: Through this comprehensive analysis, I not only uncovered significant trends in self-employment but also provided actionable insights for strategic decision-making. The ability to extract, process, and interpret intricate data sets highlights my proficiency in R programming, data analysis, and business intelligence.
This project is a testament to my commitment to delivering valuable insights through advanced data analytics, setting the stage for informed decision-making in dynamic business landscapes.